

Dropping the PAT would affect scoring leaders
By Saleem Choudhry
A hot-button topic in the National Football League so far this offseason has been the possible elimination of the extra point. NFL Commissioner Roger Goodell raised the issue during an interview on NFL Network in January and debate about the matter has seemingly intensified in the weeks since his comment.
"The extra point is almost automatic," Goodell said. "I believe we had five missed extra points this year out of 1,200 some odd (attempts). So it's a very small fraction of the play, and you want to add excitement with every play.”
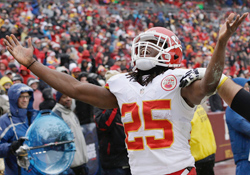 |
| Jamaal Charles would be the 2013 leading scorer under the proposed scoring change. |
The Commissioner is correct in that the extra point has become “almost automatic.” NFL teams across the board converted a record 99.6 percent of all extra point tries during the 2013 season. But in essence, the PAT has always been somewhat of a given. Only once in the modern-era (1946-present) has the successful conversion percentage of the extra point dipped below 90 percent (89.7 in 1976). The efficiency of kickers, however, has steadily improved. Since the strike-shortened 1982 season, the conversion rate on a kicker’s try after a TD has never fallen below 95 percent.
One of the solutions tossed around to replace the extra point is to raise the scoring total of a touchdown from six to seven points. After a TD is scored, the offensive team would still be given the option to attempt what we now know as a two-point conversion. If the try is successful, it would result in an additional eighth point. A failed attempt would result in a reduction of one point or just six points added to the scoreboard.
If this rule was put into place, how would it impact the yearly scoring leaders and/or the all-time scoring output? New England Patriots kicker Stephen Gostkowski, who was the 2013 scoring champion with 158 points, would not have claimed the scoring title under the suggested scoring format. He would have finished in a tie for second place with 114 points. Under the new scoring system, Kansas City Chiefs running back Jamaal Charles (who finished 18th in scoring) would have won the league title with his 19 touchdowns totaling an adjusted 133 points.
Denver Broncos kicker Matt Prater would experience one of the biggest drops. His 150 points, which ranked second in the league and benefitted greatly from a single-season record 75 PATs, drops to only 75 adjusted points and a 34th overall ranking.
What if this proposed rules change had always been the standard for scoring? A glimpse at the all-time leading scorers shows actually only minor changes at the top. Morten Andersen and Gary Anderson remain first and second respectively on the adjusted list. One player who elevates the most is wide receiver Jerry Rice who is the game’s all-time leader in touchdowns. His 1,464 adjusted points advances him from 31st to 10th on the all-time leading scorers list.
Here is a quick look at the 2013 top scorers and the all-time leading scorers under the proposed scoring changes.
2013 Adjusted Scoring Leaders |
|||||||||
| Adjusted Rank | 2013 Rank | Name | Pos. | Games | TD | PAT | FG | Pts | Adjusted Points |
| 1 | 18 | Charles, Jamaal (KC) | RB | 16 | 19 | 0 | 0 | 114 | 133 |
| 2T | 1 | Gostkowski, Stephen (NE) | K | 16 | 0 | 44 | 38 | 158 | 114 |
| 2T | 6 | Tucker, Justin (BLT) | K | 16 | 0 | 26 | 38 | 140 | 114 |
| 4 | 31 | Graham, Jimmy (NO) | TE | 16 | 16 | 0 | 0 | 96 | 112 |
| 5 | 8 | Vinatieri, Adam (IND) | K | 16 | 0 | 34 | 35 | 139 | 105 |
| 6 | 3 | Novak, Nick (SD) | K | 16 | 0 | 42 | 34 | 144 | 102 |
| 7T | 4 | Hauschka, Steven (SEA) | K | 16 | 0 | 44 | 33 | 143 | 99 |
| 7T | 5 | Crosby, Mason (GB) | K | 16 | 0 | 42 | 33 | 141 | 99 |
| 7T | 9 | Carpenter, Dan (BUF) | K | 16 | 0 | 32 | 33 | 131 | 99 |
| 7T | 13 | Folk, Nick (NYJ) | K | 16 | 0 | 27 | 33 | 126 | 99 |
| 11T | 34 | Lynch, Marshawn (SEA) | RB | 16 | 14 | 0 | 0 | 84 | 98 |
| 11T | 34 | Thomas, Demaryius (DEN) | WR | 16 | 14 | 0 | 0 | 84 | 98 |
| 13 | 6 | Dawson, Phil (SF) | K | 16 | 0 | 44 | 32 | 140 | 96 |
| 14T | 37 | Bryant, Dez (DAL) | WR | 16 | 13 | 0 | 0 | 78 | 91 |
| 14T | 37 | Moreno, Knowshon (DEN) | RB | 16 | 13 | 0 | 0 | 78 | 91 |
| 14T | 37 | Davis, Vernon (SF) | TE | 16 | 13 | 0 | 0 | 78 | 91 |
| 17T | 11 | Suisham, Shaun (PIT) | K | 16 | 0 | 39 | 30 | 129 | 90 |
| 17T | 12 | Feely, Jay (ARZ) | K | 16 | 0 | 37 | 30 | 127 | 90 |
| 19 | 40 | Marshall, Brandon (CHI) | WR | 16 | 12 | 0 | 0 | 76 | 88 |
| 20 | 41 | Forte, Matt (CHI) | RB | 16 | 12 | 0 | 0 | 74 | 86 |
All-Time Adjusted Top 40 |
|||||||||
| Adjusted All-Time Rank | All-Time Rank | Name | Pos. | TD | FG | PAT | 2PT | Pts | Adjusted Points |
| 1 | 1 | Andersen, Morten | K | 0 | 565 | 849 | 0 | 2,544 | 1,979 |
| 2 | 2 | Anderson, Gary | K | 0 | 538 | 820 | 0 | 2,434 | 1,896 |
| 3 | 7 | Blanda, George | QB-K | 9 | 335 | 942 | 0 | 2,002 | 1,676 |
| 4 | 3 | Hanson, Jason | K | 0 | 495 | 665 | 0 | 2,150 | 1,655 |
| 5 | 4 | Carney, John | K | 0 | 478 | 628 | 0 | 2,062 | 1,584 |
| 6 | 5 | Vinatieri, Adam | K | 0 | 448 | 660 | 1 | 2,006 | 1,558 |
| 7 | 8 | Elam, Jason | K | 0 | 436 | 675 | 0 | 1,983 | 1,547 |
| 8 | 6 | Stover, Matt | K | 0 | 471 | 591 | 0 | 2,004 | 1,533 |
| 9 | 9 | Kasay, John | K | 0 | 461 | 587 | 0 | 1,970 | 1,509 |
| 10 | 31 | Rice, Jerry | WR | 208 | 0 | 0 | 4 | 1,256 | 1,464 |
| 11 | 10 | Johnson, Norm | K | 0 | 366 | 638 | 0 | 1,736 | 1,370 |
| 12 | 11 | Akers, David | K | 0 | 386 | 563 | 0 | 1,721 | 1,335 |
| 13 | 12 | Lowery, Nick | K | 0 | 383 | 562 | 0 | 1,711 | 1,328 |
| 14 | 13 | Stenerud, Jan | K | 0 | 373 | 580 | 0 | 1,699 | 1,326 |
| 15 | 14 | Longwell, Ryan | K | 0 | 361 | 604 | 0 | 1,687 | 1,326 |
| 16 | 15 | Murray, Eddie | K | 0 | 352 | 538 | 0 | 1,594 | 1,242 |
| 17 | 16 | Del Greco, Al | K | 0 | 347 | 543 | 0 | 1,584 | 1,237 |
| 18 | 47 | Smith, Emmitt | RB | 175 | 0 | 0 | 1 | 1,052 | 1,227 |
| 19 | 17 | Mare, Olindo | K | 0 | 356 | 487 | 0 | 1,555 | 1,199 |
| 20 | 20 | Leahy, Pat | K | 0 | 304 | 558 | 0 | 1,470 | 1,166 |
| 21 | 18 | Janikowski, Sebastian | K | 0 | 345 | 454 | 0 | 1,489 | 1,144 |
| 22 | 19 | Christie, Steve | K | 0 | 336 | 468 | 0 | 1,476 | 1,140 |
| 23 | 21 | Turner, Jim | K | 1 | 304 | 521 | 0 | 1,439 | 1,136 |
| 24 | 55 | Tomlinson, LaDainian | RB | 162 | 0 | 0 | 0 | 972 | 1,134 |
| 25 | 23 | Bahr, Matt | K | 0 | 300 | 522 | 0 | 1,422 | 1,122 |
| 26 | 30 | Groza, Lou | T-K | 1 | 234 | 641 | 0 | 1,349 | 1,116 |
| 27 | 22 | Feely, Jay | K | 1 | 329 | 444 | 0 | 1,437 | 1,109 |
| 28 | 24 | Wilkins, Jeff | K | 0 | 307 | 495 | 0 | 1,416 | 1,109 |
| 29 | 60 | Moss, Randy | WR | 157 | 0 | 0 | 4 | 950 | 1,107 |
| 30 | 27 | Bakken, Jim | K | 0 | 282 | 534 | 0 | 1,380 | 1,098 |
| 31 | 62 | Owens, Terrell | WR | 156 | 0 | 0 | 3 | 942 | 1,098 |
| 32 | 28 | Cox, Fred | K | 0 | 282 | 519 | 0 | 1,365 | 1,083 |
| 33 | 26 | Moseley, Mark | K | 0 | 300 | 482 | 0 | 1,382 | 1,082 |
| 34 | 25 | Dawson, Phil | K | 1 | 337 | ||||
Top 20 at the Start of 2014
We’re happy to fill your offseason football void with our expanded Top 20 lists.
Giants, Bills to kick off ’14 in Canton
The New York Giants and Buffalo Bills will kick off the 2014 NFL Preseason at Pro Football Hall of Fame Field at Fawcett Stadium on Sunday, Aug. 3.